Infographics: The Easy All-You-Need-to-Know Guide
Table of Contents
What Are Infographics?
Expressing data and engaging interest in your product, your research or your brand can often be difficult, particularly as there’s no one way in which audiences are most likely to learn or to be influenced. While some marketing and advertising techniques are ‘tried and tested’ and really do bring home the results, you can’t go wrong with an infographic to impart essential information about you and your business upon an audience.
An infographic is, essentially, a clever, contemporary and visual way of displaying and communicating information to the reader. Infographics can come in all shapes and sizes, but they are all eye-catching, logically arranged and feature facts, figures and other titbits of information that can be offered up in easily-digestible portions. Some infographics focus on statistics, while others offer readers a visual, logical walkthrough on how to complete certain tasks and how they can make best use of your services.
Infographics benefit from one key element to help tie it all together – a theme – one which is relevant, fun and cleverly adhered to throughout. An infographic is like a roadmap – it has a start, a middle and an end – and the best ones offer logical routes as well as thematic choices.
What Do Infographics Do?
Infographics do exactly what any old collection of statistics, data and charts can do – only they do so in a visually appealing and coherent manner. They actively aim to filter out unnecessary waffle or irrelevant information and data by picking out what their audience wants to see, wants to read about and what they can really benefit from knowing.
This isn’t the only facet of an infographic – they communicate interesting and useful information through creative designs and data which is easy to read and vivid enough to stand out from the crowd. Anyone worth their salt can produce a set of statistics to pore through, but it takes a particular designer to be able to create an infographic that communicate such data in a way that everyone finds appealing and easy to digest.
The creation of an infographic requires understanding of existing data that may not be so easy to comprehend at a glance – and the ability to simplify and communicate the key messages across to the audience. Essentially the work of an infographic is to offer information in a fun and appealing way – a way in which the reader can be educated, but they don’t necessarily feel they have been!
Dress up Your Data
Infographics need to look good, full stop – but what makes a great design? A great-looking infographic makes use of a range of different visuals, from charts to statistics to cartoons – and while an infographic should always use text to its advantage, it should always be used in a way which works with its purpose and which doesn’t distract the audience. Click here to see the 20 best infographics tutorials and articles.
Text in an infographic should generally be sparing on each point – this is what makes their content so digestible! Throw in a few statistics, facts and figures and make the ones that really matter stand out – use appealing fonts, colours and style choices that both work well with your theme and drive attention to the statistics and messages which you want to communicate the most.
Why not integrate content such as illustration or even video to help drive home your message? Don’t just throw charts and random statistics at your readers ad infinitum – make an effort to entertain them as well as to educate them. This is where your theme can come in well – no matter what it may be, making your information journey fun and engaging really is the name of the game.
But where do you even start when it comes to designing the bare bones of an infographic? Simple – you do the research and shop around. A simple Google search will always bring up effective and popular infographics that teach and engage well with readers. Truly eye-catching or clever flowcharts will make their way to social media with ease, with both Facebook and Pinterest being the prime candidates for sharing.
You can even hire a talented graphic artist to do all the hard work for you – but you’ll need to make sure you have your theme, your ideas, your purpose, your key audience and (most crucially) your data and content ironed out and sorted first. This means, of course, that you’ll need to take time out to toothcomb through your work and ensure that it can be easily incorporated into a simple but effective visual design. A clear design direction is absolutely the way forward for an effective and engaging infographic.
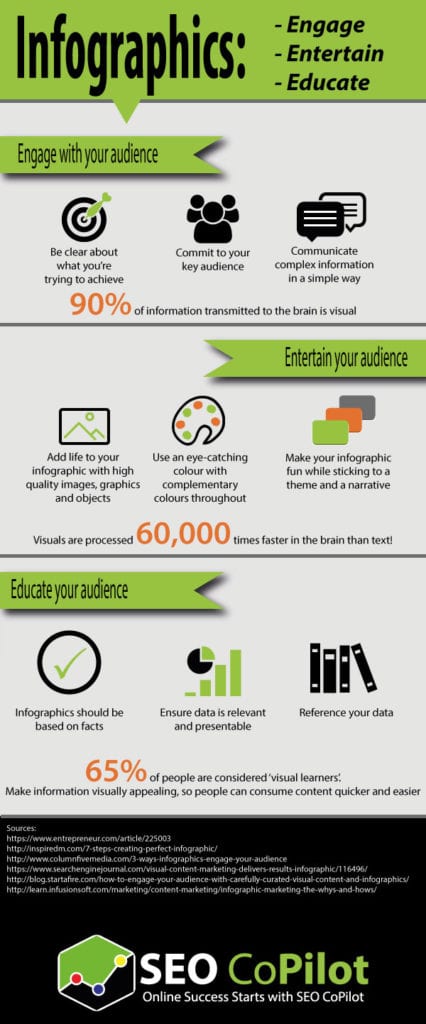
Engage, Entertain and Educate
If you’ve already got your marketing persona or brand figured out, it’s likely you’ll already have a great idea about how to commit to your key audience. You’ll know what makes them tick, what they’re interested in, and you may even know what appeals to their interests and to their intellects. This way, you’ll have more than a good idea about how to approach setting up the bare bones of your infographic.
Is your audience likely to inhale information? It’s time to focus on statistics. Find topics that your followers and readers are likely to be engaged with and focus upon an uncommon angle – use your research to find articles and sources that are rarely cited, but retain credibility.
While sticking to a theme and a narrative, you should be able to make things fun for your reader without dipping too far into solid data – a graphic designer will likely be able to help turn your information into something digestible and attractive, but you should also focus on filtering your content down to something that both informs and entertains. We are all fascinated by the obscure, new twists on the way we look at things, and mind-blowing statistics – offer a new way of looking at things by using your available data and you’ll like have engagement and entertainment covered – and a lot of this will already be covered by the visual aspect.
Education is, again, all down to you – it’s a case of filtering down your content and ensuring that your data is both relevant to your audience and that it gives them something new to think about. You should also think carefully about the journey that your infographic makes – what have your readers learned by the very foot of the image, and where are they in comparison with where they were at the head? Much of this thinking will come into play when considering your infographic’s narrative, which we will cover shortly.
Keep It Credible
Despite infographics largely being entertaining and light-hearted, you should always retain credibility in anything and everything you build and design – meaning that you should be putting together content that relies upon sources that can be easily found and depended upon for further study. You should always credit any statistics and information you draw from without question – but the wider the sources you draw from, the more credibility your infographic will gain. A piece that draws from multiple sources is more likely to be depended upon for future research, and will therefore encourage more people to read and share your infographic.
Here are some tools for making infographics:
Tell a Story!
An effective infographic is one that has a working narrative – one which has logical goals and allows readers to naturally progress from a starting point through to an end goal. An easy way to encourage effective infographic narrative is to focus upon your title and to consider where you’d like your readers to be by its end. Consider mapping out a story that throws in an idea at the start, statistics and complications in the middle and a satisfying conclusion at the end. All good storytellers know that the three-point structure should never be toyed with – and the same goes for infographics.
Try reading some other infographics yourself – what works well for you? Do you find yourself swept along by statistics and figures, or a narrative that relies heavily upon theme and design? You have to consider your own tastes as much as your audience’s – after all, it’s your brand and your business – but effective infographics always ensure that there is a cognitive path to follow.
<a href="https://www.seo-copilot.co.uk/web-design"><img src="https://www.seo-copilot.co.uk/wp-content/uploads/2016/09/marketing-your-infographic.png"></a>Logical Pathways
As discussed, building an effective infographic is all about telling a story – and stories all need logical pathways and conclusions. Why throw in data and statistics that are irrelevant to your theme and reader for the sake of it?
Understand where your prospective audience is starting from and establish what their journey is going to entail – they are first of all going to need to understand and appreciate any topics at hand on a base level, meaning that entry-level sources and brief discussion are always helpful (of course, keeping as brief as possible!). Your audience needs to be engaged as early as possible, meaning that it is always worthwhile encouraging your audience on with an effective statistic or two and an entertaining layout so that they can be prepared for the middle and, eventually, a conclusion.
Your next logical pathways from here should be to discuss any data or statistics you have raised and to consider exactly why your brand or business should be relied upon to provide a solution (if relevant). Logic dictates that further discussion and deeper statistics should be drawn upon once your audience has an understanding or at least an appreciation of the topic and arguments at stake, leading towards a natural conclusion that is both well-argued and backed up by reliable sources – no matter how rare they may be.
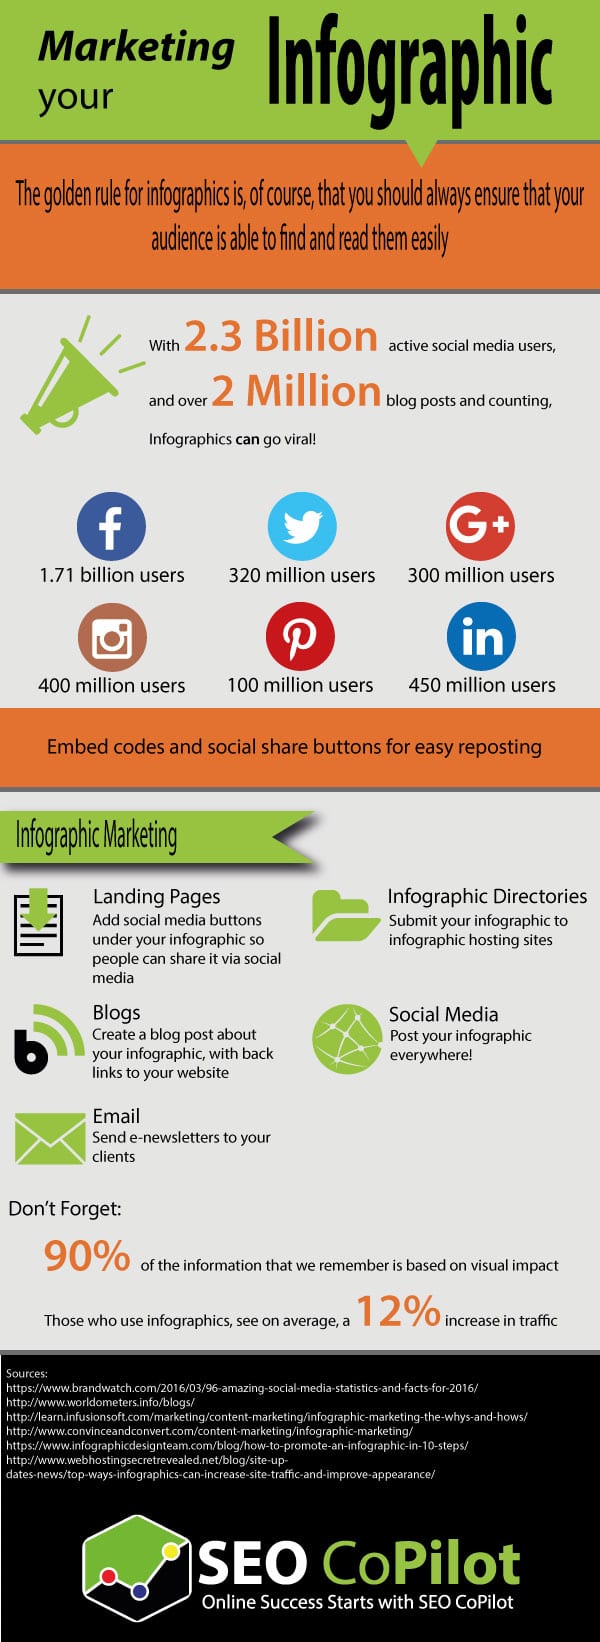
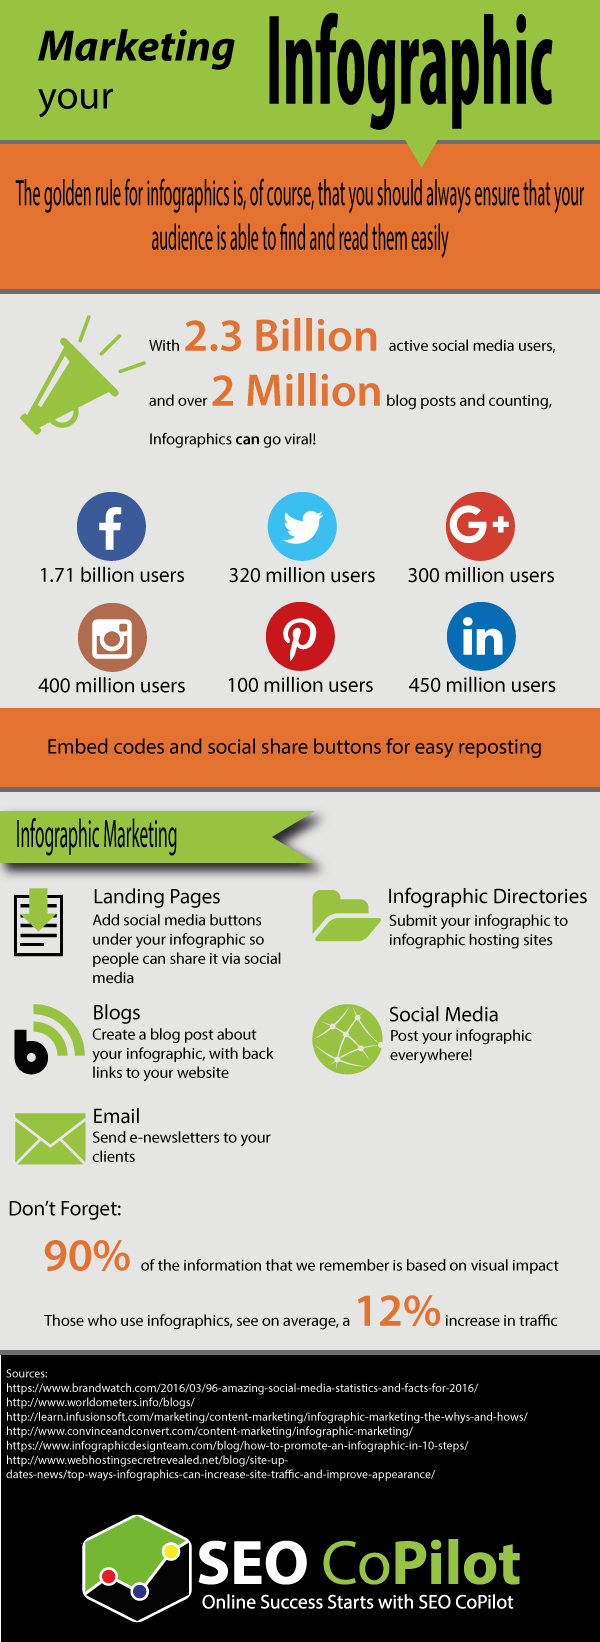
Promote, promote, promote!
The golden rule for infographics is, of course, that you should always ensure that your audience is able to find and read them easily. Your key to success here lies both in social media and via your own website.
Social media, particularly those which concentrate on image sharing, should be your best allies at this stage. Facebook and Pinterest are heavily focused upon image sharing and will therefore offer you quick and effective opportunities to plug your new infographic to as many people as possible. Facebook pages are fantastic at allowing fans of your brand or service to keep up to date on your latest news and developments, and something as easy to read and simple to share as an attractive and entertaining infographic will always go down a storm with the right people.
Try Pinterest
Pinterest is also particularly useful in this regard, as users can ‘pin’ or save infographics or short, simple guides to their own personal folders for future viewing. Pinners hold collections on topics as diverse as cookery, photography and fashion – and depending upon your area of business or expertise, an infographic will sit rather well in a pinner’s pinboard for future digestion.
You should never underestimate your own website, however – as regular blogging will ensure to let your audience know that you’re invested and active. Sharing infographics is as easy via blog as it is via social media, meaning that it is always worthwhile keeping your options open from platform to platform.
Get Started Today!
What makes a good infographic? In conclusion, while infographics look great and allow us to read and digest information easily and efficiently, you should never skimp on the content, your sources, nor the manner in which you are selling your information to your audience. There is much more to an infographic than mere visual design – meaning that you should always prepare your content and any data you wish to share to your readers carefully before looking to build an infographic from scratch.
Infographics can really help your business take off on a multitude of platforms, and we can help you reach more of the people you are looking to convert into regular customers. For more information on how web design and infographics can bring lucrative new business to you and your enterprise, call SEO CoPilot today on 01246 540869 or contact us via web form.
